University of Maryland, Baltimore, School of Medicine
Images
Movie showing 10A, PTEN-/-, KRas, and KRas/PTEN-/- cells migrating as collective sheets over 12 h. Scale bars indicate 100 µm and clock displays HH:MM. Videos by Dr. Rachel Lee
Click on images to view full size with captions
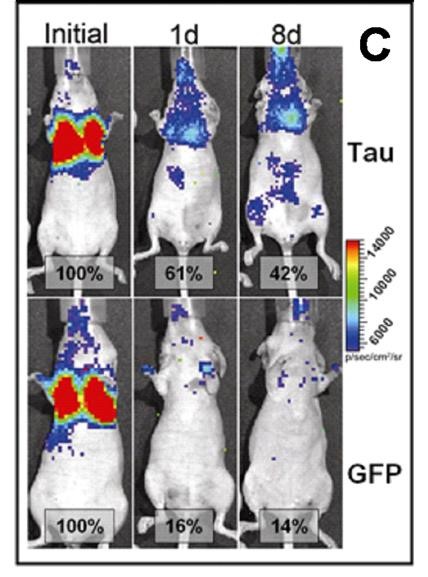
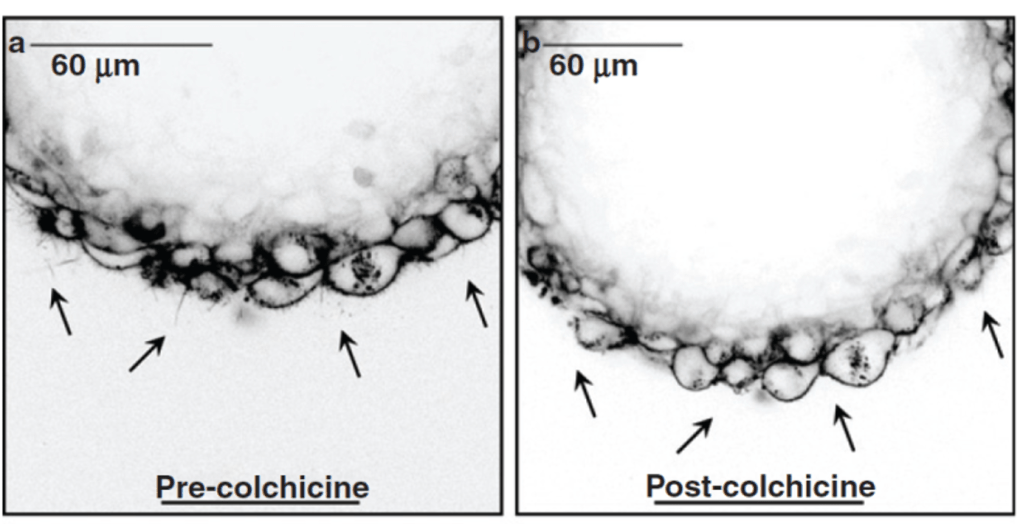
McTNs in fresh patient tumor cells (surgical biopsy) – UnpublishedMicrotubule stabilization with Tau promotes McTNs and increases retention of tumor cells in the lungs of living mice
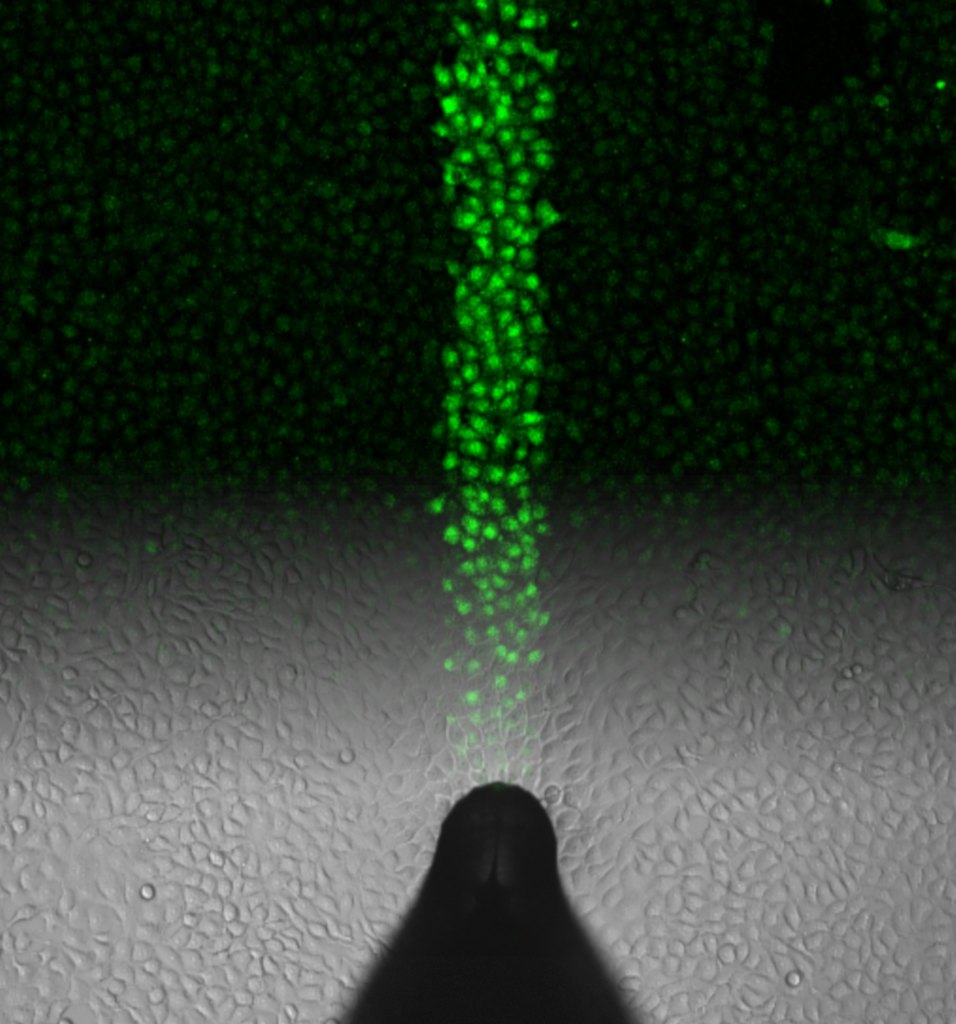
Matrone, M.A., et al(2010). Oncogene 29(22):3217-27.Mechanical stimulation on low elastic modulus dishes (mSLED) initiates calcium signaling within seconds in human breast epithelial cells, but can last up to 30 minutes.
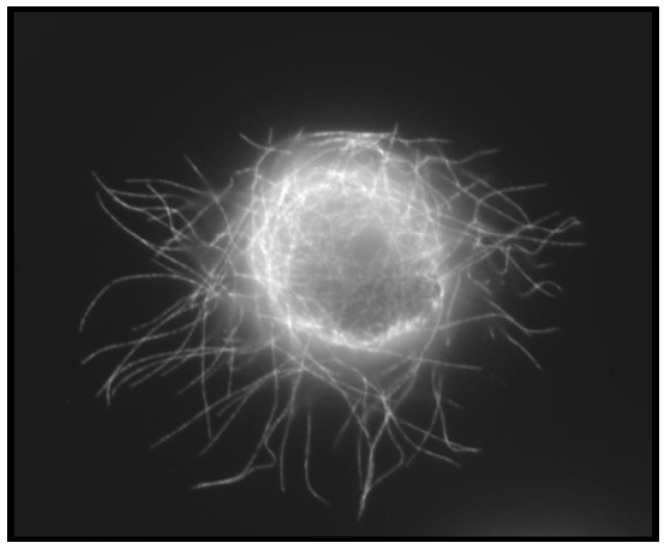
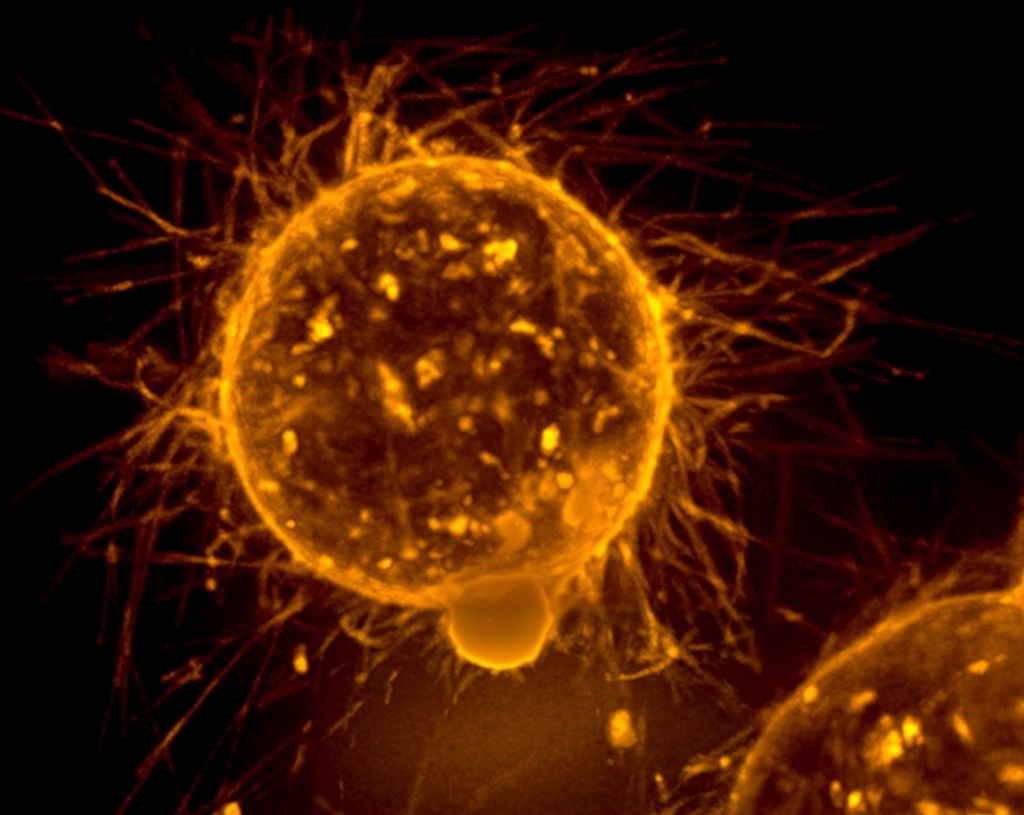
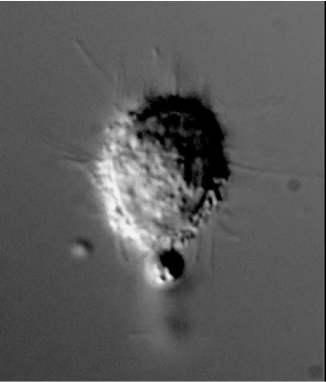
Pratt SJP, et al (2020). Proc. Natl. Acad. Sci. USA 20;117(42):26008-26019.Breast cancer cells produce microtentacles in response to detachment. Confocal microscopy of a suspended breast tumor cell reveals tubulin-based long, flexible microtentacles.
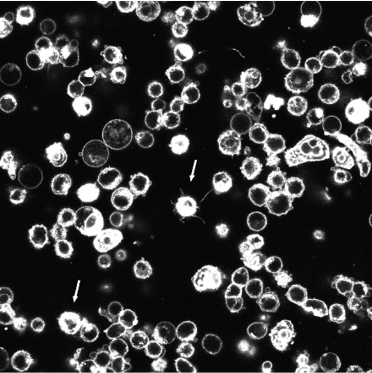
Charpentier, M., & Martin, S. (2013). Cancers, 5(4), 1545–1565. EMT promotes increased McTNs and tubulin detyrosination in detached HMLEs. Phase contrast images of attached HMLE Twist and Snail cells compared to HMLE-GFP (top panel). Detached HMLE Twist and Snail display extensive membrane McTNs (lower panel, black arrows).
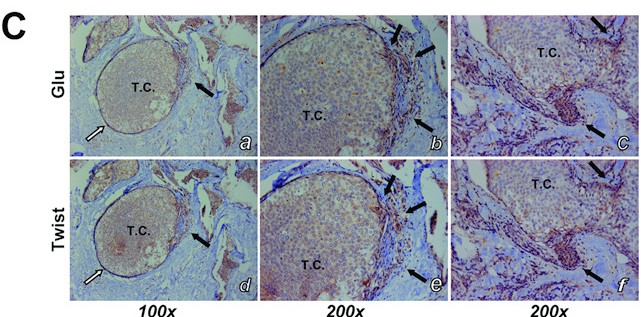
Whipple, R.A., et al (2010). Cancer Research70(20):8127-37 EMT and Glu-tubulin are upregulated at invasive tumor fronts in breast cancer patients
Whipple, R.A., et al (2010). Cancer Research70(20):8127-37 (Cover). – Collaboration with Jing Yang (UCSD)Live cell confocal microscopy of McTNs in mammopsheres
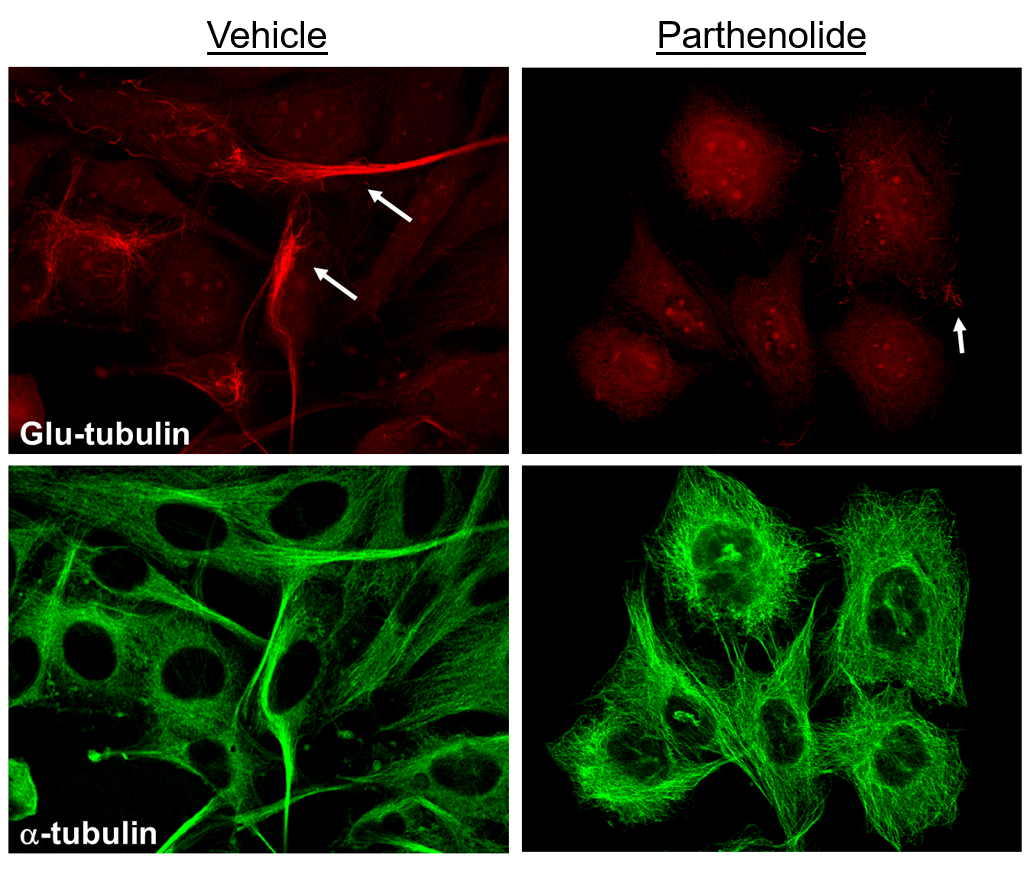
Charpentier, M.S., et al (2014). Cancer Research74(4):1250-60.Early CellMask Stain – Eric Balzer, unpublishedSelective effect of Parthenolide on Glu-tubulin (experiments from study listed below, but this image is unpublished)
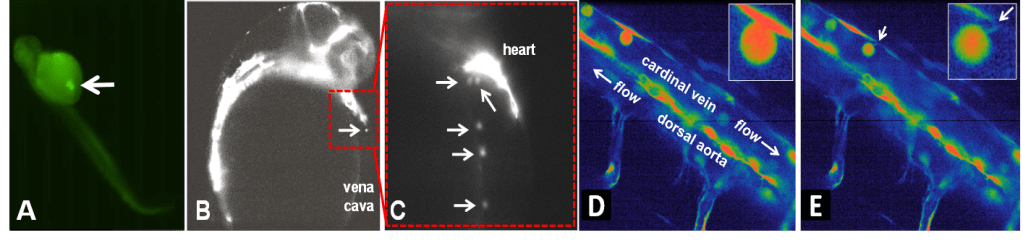
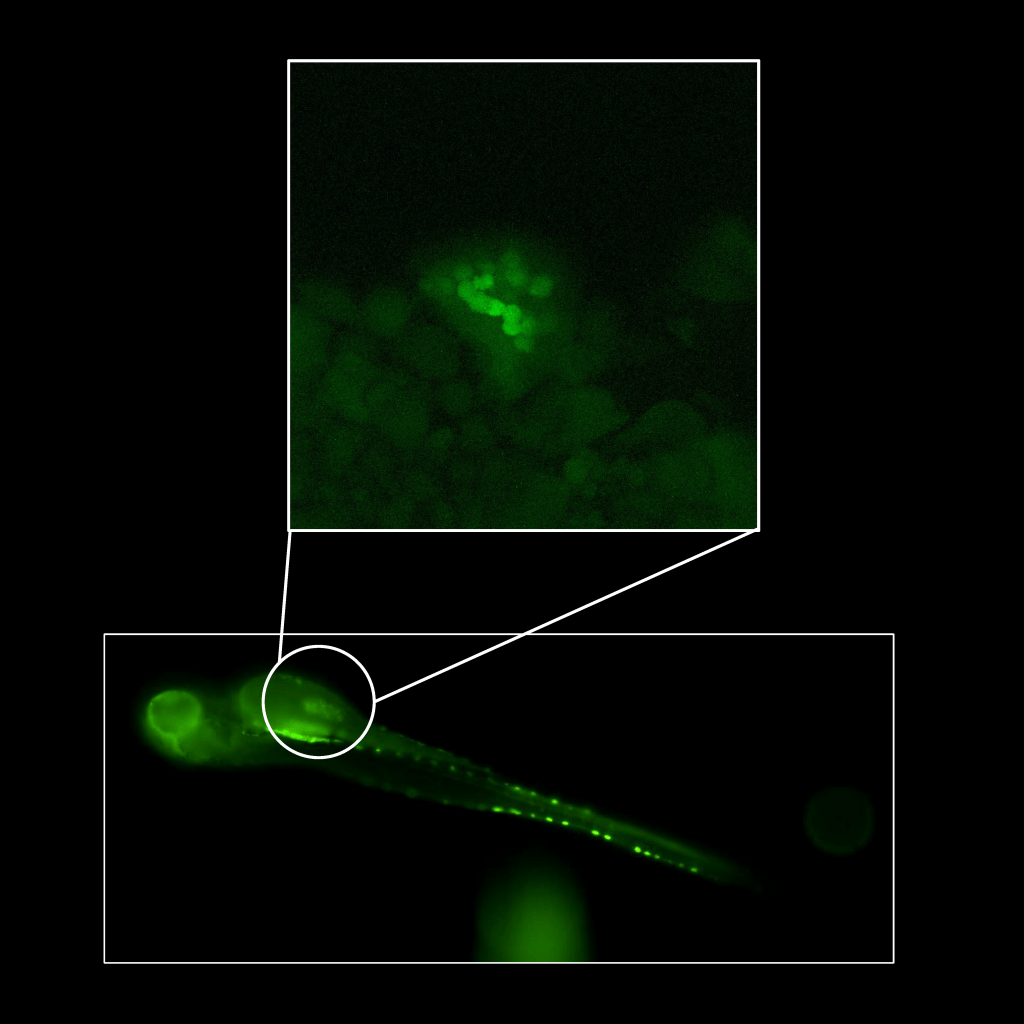
Whipple, R.A., et al (2013) Breast Cancer Research15(5):R83.Imaging MDA-231 cells circulating in zebrafish embryos. A) Zebrafish embryos with fluorescently-labeled vasculature (fli:eGFP) were injected with approximately 1000 human breast tumor cells (MDA-231) which were also labeled with GFP. Epifluorescence microscopy revealed the injected tumor cells (white arrow) in the yolk sac (Duct of Cuvier). B) Light sheet imaging allowed the visualization of GFP-labeled MDA-231 cells traveling via the vena cava (white arrow) toward the zebrafish heart. C) Higher magnification (inset red dotted line box) shows a continuous stream of MDA-231 CTCs entering the heart (white arrows). D) Nikon W1 spinning disk confocal microscopy (>200 frames per second) captures CTC rolling in the cardinal vein of the tail, and McTN binding to blood vessel walls (E, arrows).DIC Imaging of McTNs in live cells
Yoon J.R., et al (2011). Breast CancerRes Treat. 129(3):691-701.Casper zebrafish injected with MDA-MB-231-GFP cells
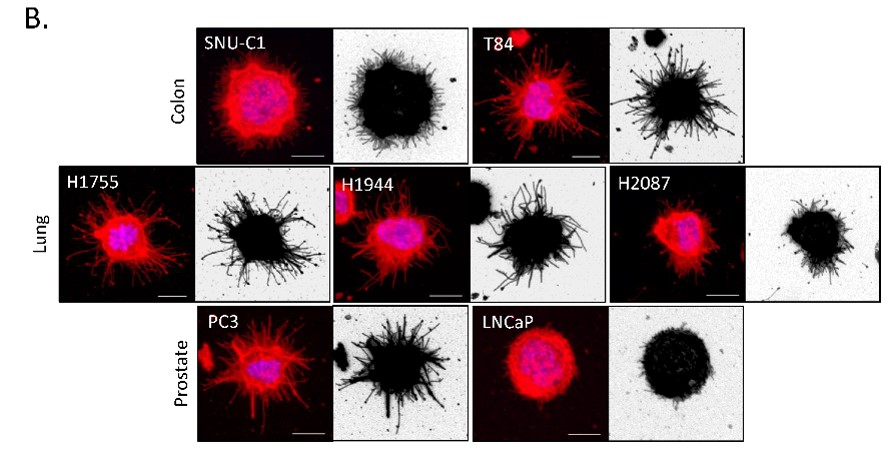
Ju, J.A. (unpublished)Thermal-crosslinking of PEM+DOTAP also retains colon, lung and prostate cancer cell lines. Representative images of each cancer cell line that was tethered, fix and stained with Hoechst 33258 (1 : 5000) and WGA (1 : 100) (left panel) and the same image inverted (right panel) to better visualize McTN formation. Images were taken at 60× magnification using an Olympus IX81 microscope with a Fluoview FV1000 confocal laser scanning system. Scale bar = 10 μm.
Ju, J. A., et al (2020). Lab on a Chip, 20(16), 2872–2888.
MDA-MB-436 cell tethered onto a TetherChip showing how the ends of free-floating microtentacles ball up when fixative is added.
videos by Julia Ju
MDA-MB-436 cells tethered onto a TetherChip showing microtentacles that are allowed to settle down and tether to the lipid are not as affected by the addition of the fixative.
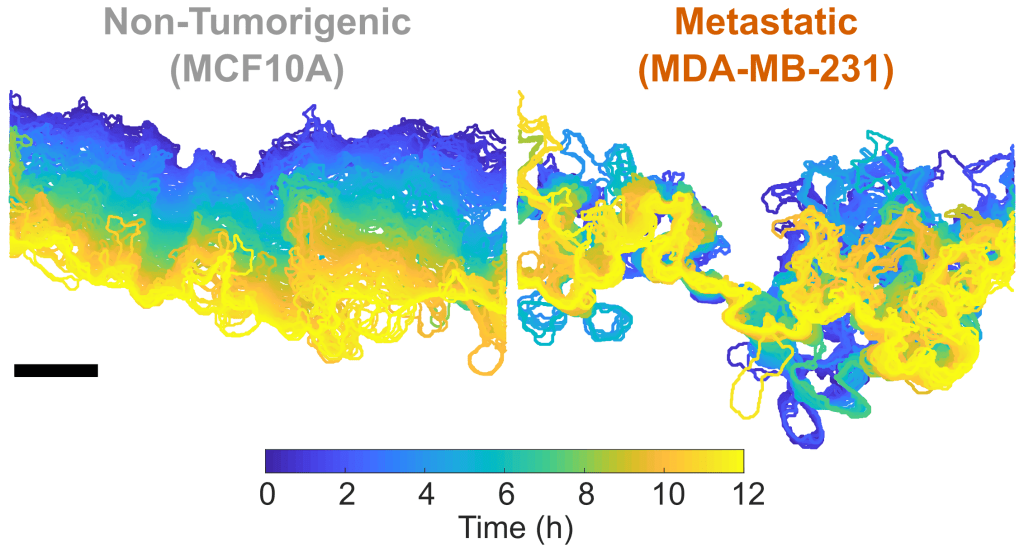
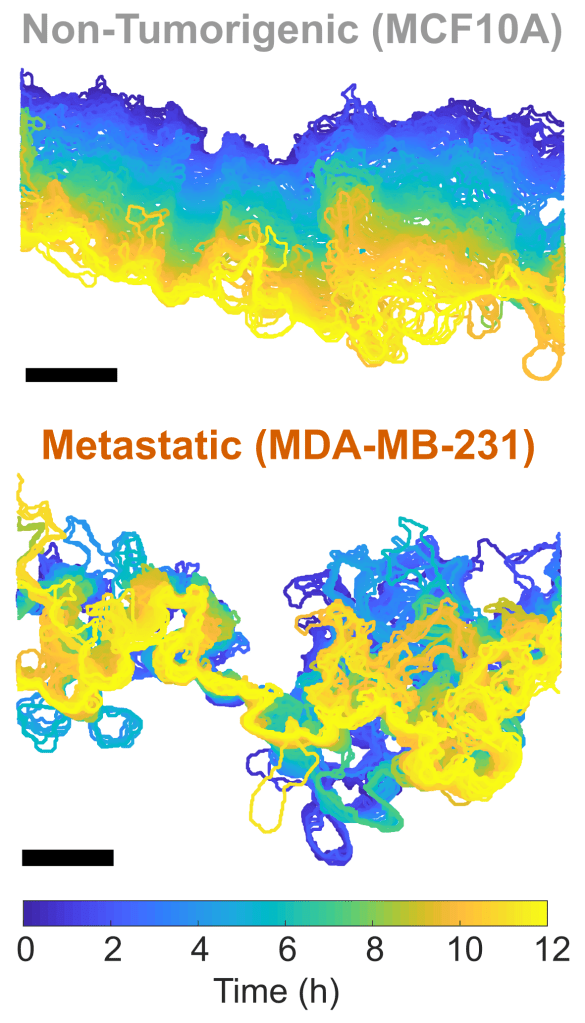
These images represent the leading-edge dynamics of a migrating collective sheet of cells. The non‑tumorigenic MCF10A show a smooth progression from 0 h (blue) to 12 h (yellow) while the metastatic MDA-MB-231 cells display a disordered progression. Scale bars indicate 100 µm. Lee, R. M., et al (2021). Scientific Reports 11, no. 1:10291.These images represent the leading-edge dynamics of a migrating collective sheet of cells. The non‑tumorigenic MCF10A show a smooth progression from 0 h (blue) to 12 h (yellow) while the metastatic MDA-MB-231 cells display a disordered progression. Scale bars indicate 100 µm. Lee, R. M., et al (2021). Scientific Reports 11, no. 1:10291.Image illustrates the use of particle image velocimetry (PIV) to extra motion information from a phase contrast image of MCF10A cells.Images by Dr. Rachel Lee